Chris Woodard

Enjoy browsing my data analytics and data science projects.
LinkedIn
Medium (featured in Towards Data Science, a Medium blog with 20M monthly views)
Tableau Public
Strava (running!)
Portfolio
Building a Stock Ticker Visualizer with R Shiny Apps
For this project, I learned the basics of building an R Shiny App by visualizing stock candlesticks and volume over a user-input date range. In the process, I learned about basic R Shiny App syntax, reactive functions, the quantmod package for fetching stock prices from Yahoo Finance, and building user interfaces.
Visualizing COVID-19 Spread with Tableau Animations
Tableau Public
This project arose out of an interest to visualize how COVID-19 hotspots have shifted over the course of the unfolding pandemic. Ever since watching this video, I’ve been interested in time-based animations like the “racing bar chart” shown in the video. Since COVID outbreaks are highly linked with geography, I’m going to attempt to recreate an animated map version and some racing bar charts to see what we can learn.
.gif)
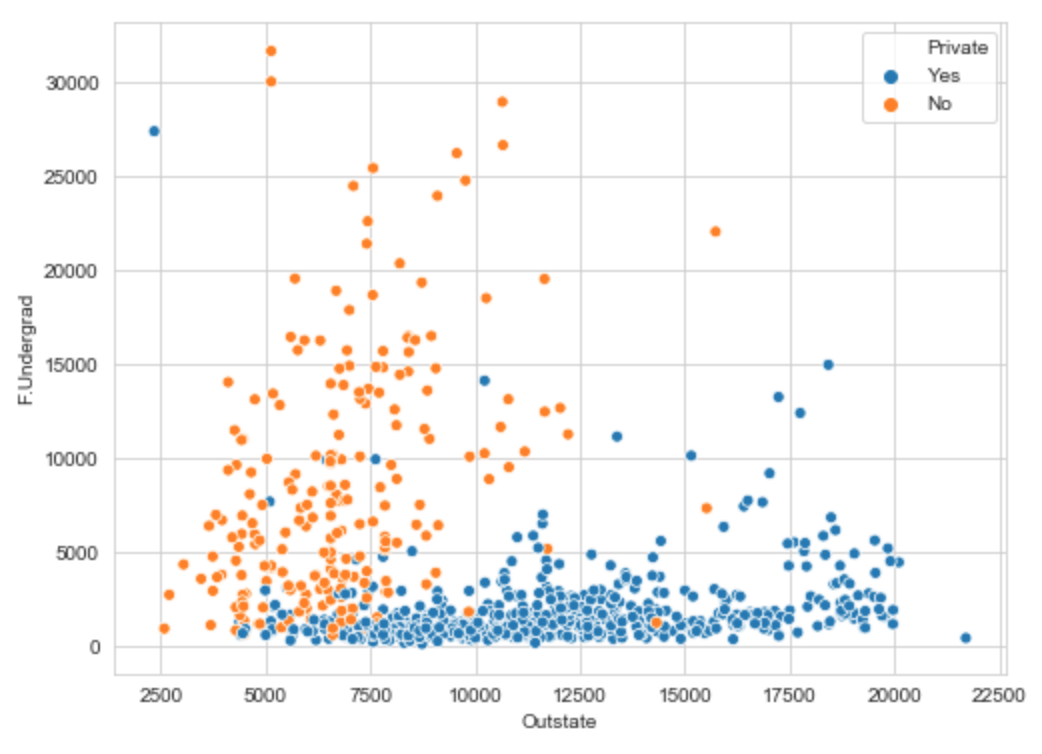
K Means Clustering of University Data
For this project, I use K-means clustering, a common unsupervised machine learning model, on a universities dataset to predict whether a model can correcly cluster public and private schools.
Page template forked from evanca